The Easiest Way to Create Beautiful, Professional Plots
Vibeplot.ai transforms your data into stunning visualizations using the power of ggplot2 and R—no coding required. Simply upload your CSV, describe what you want to see, and let our AI do the rest.
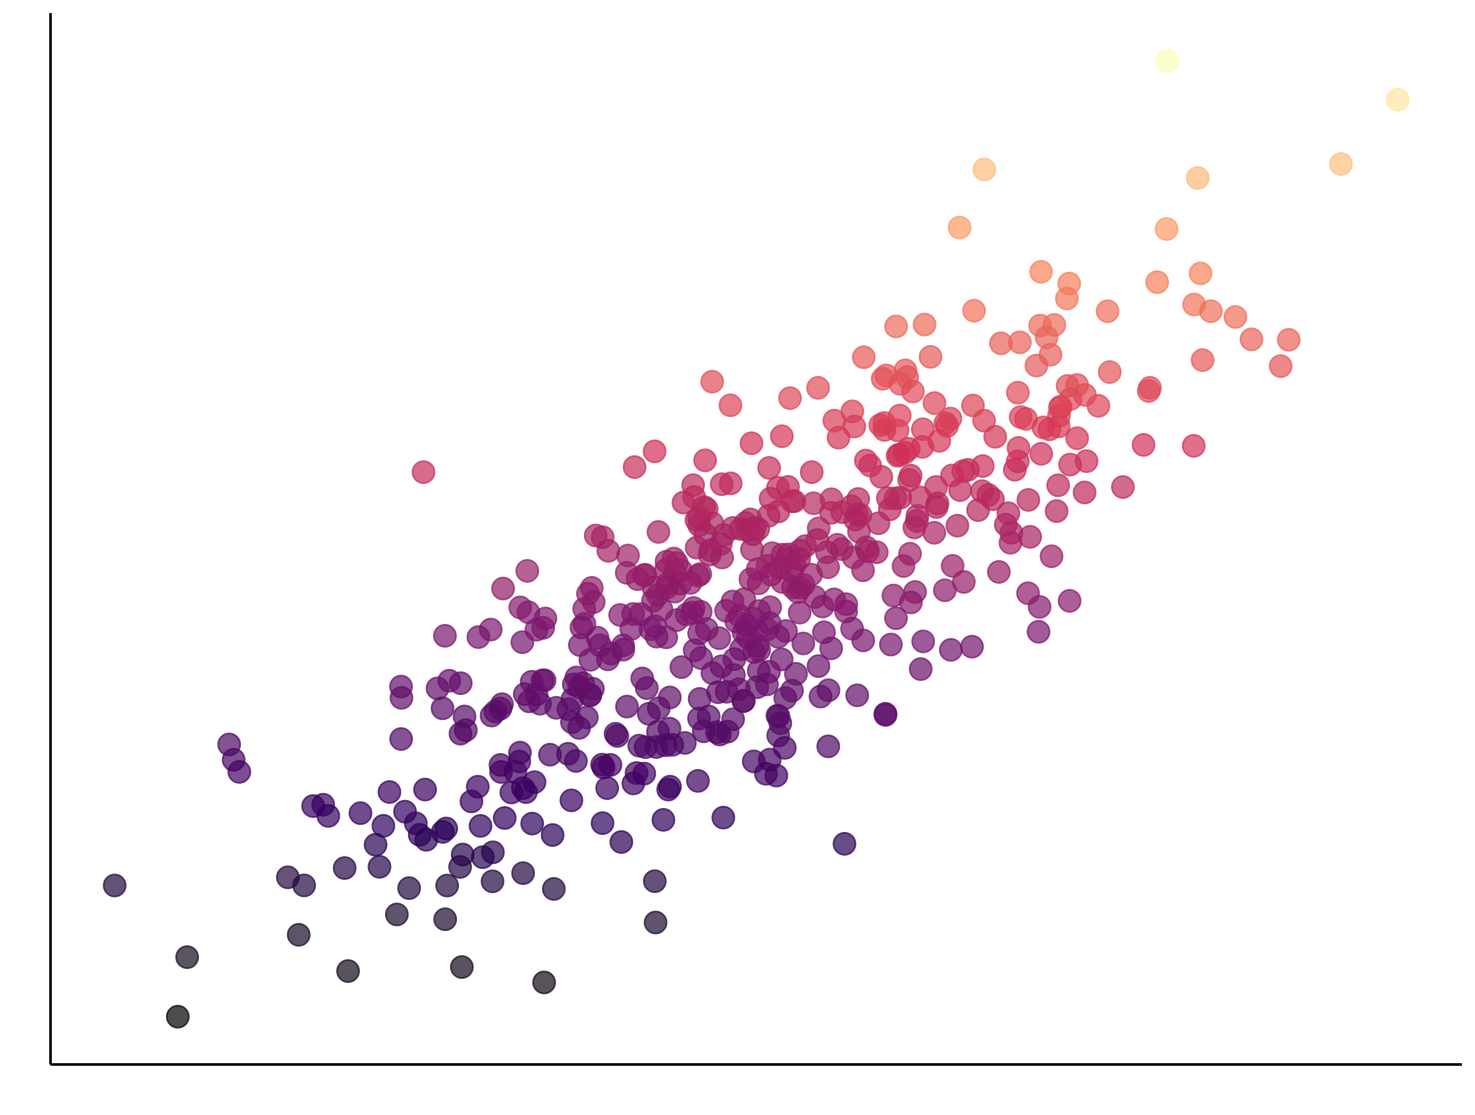
Scatter Plot with Trend Line
Visualizing correlation between variables with confidence intervals
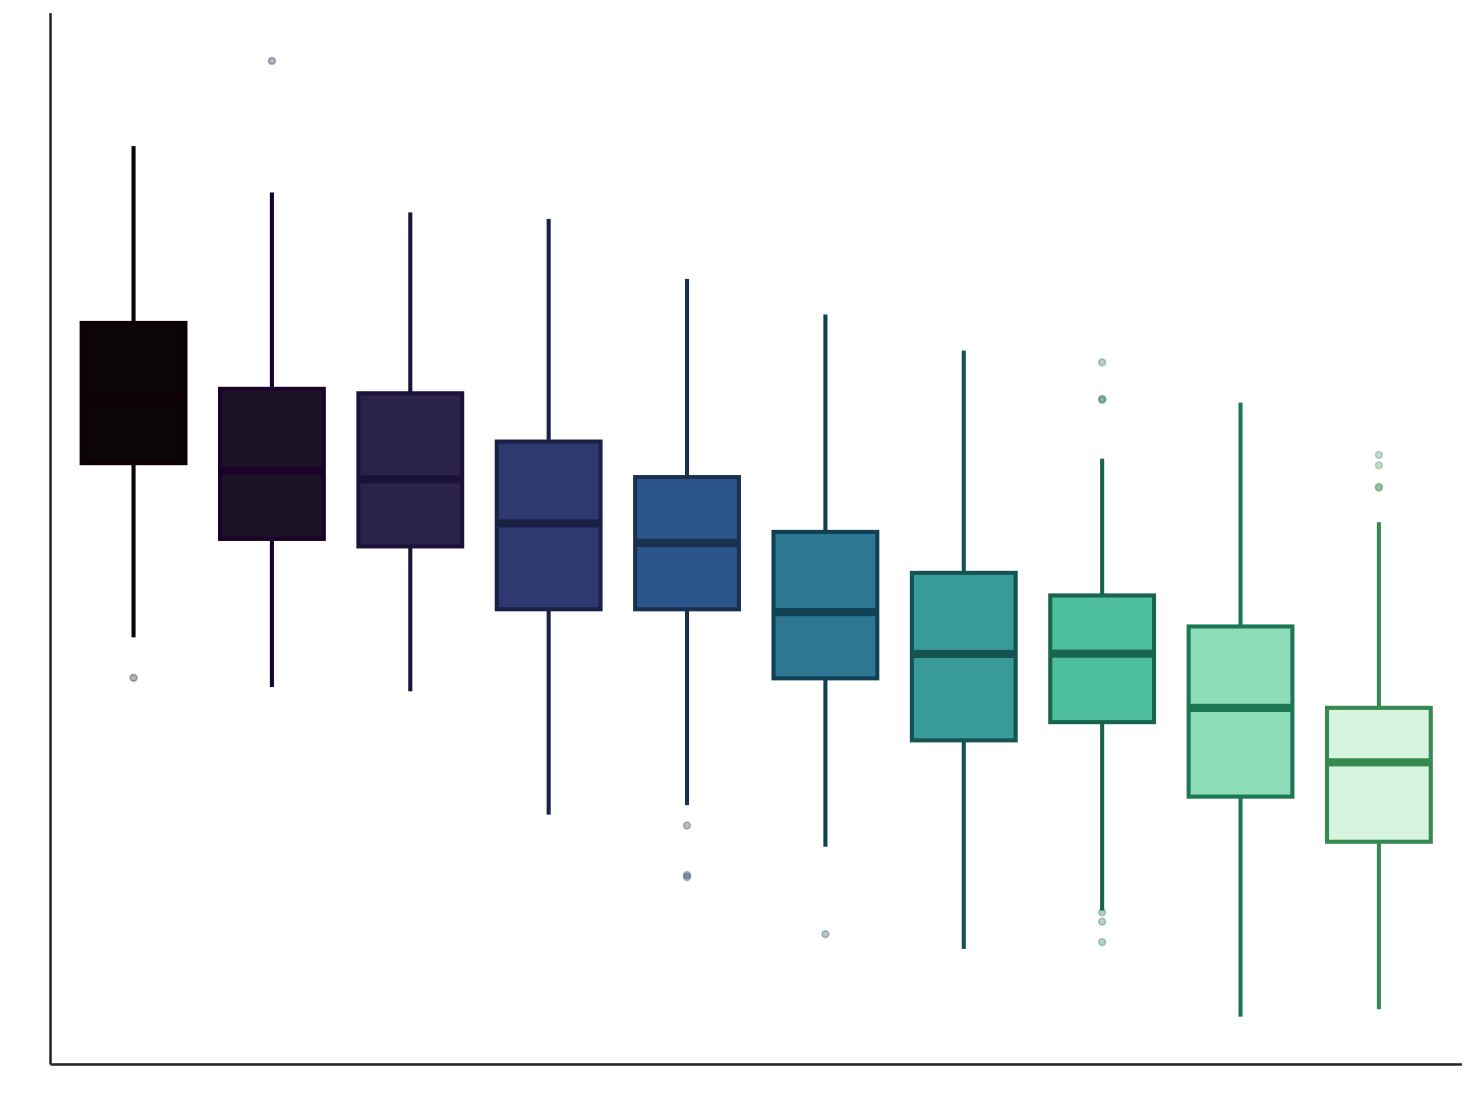
Box Plot Comparison
Comparing distributions across multiple groups
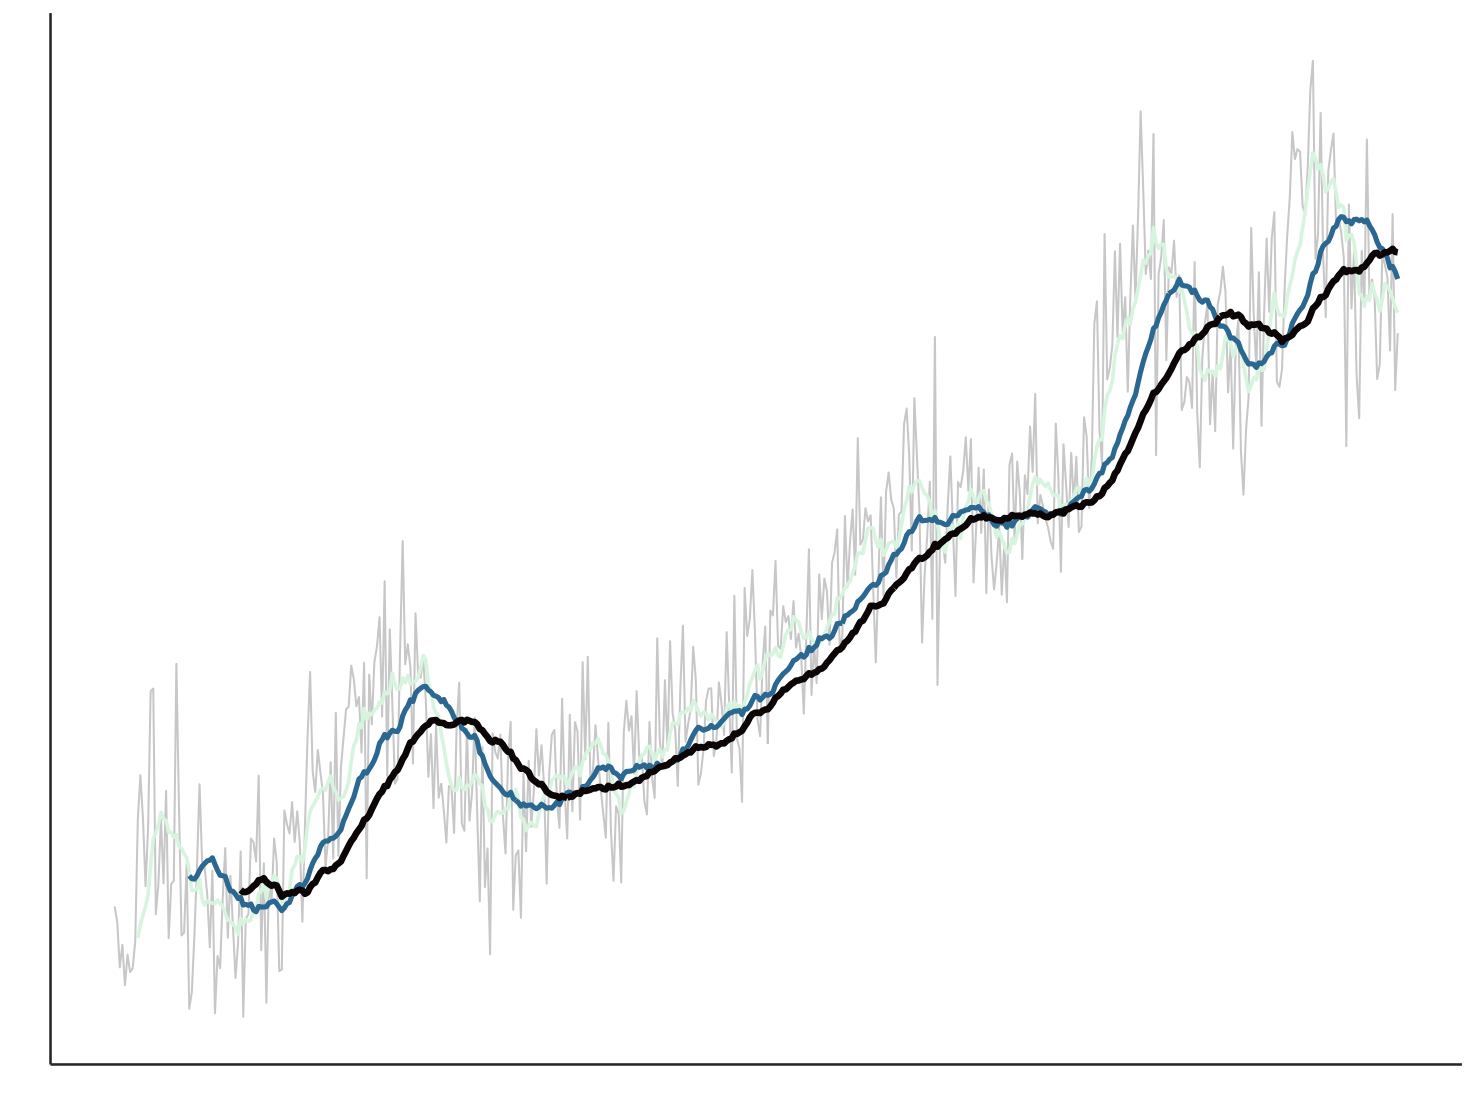
Time Series Analysis
Tracking trends over time with smoothing
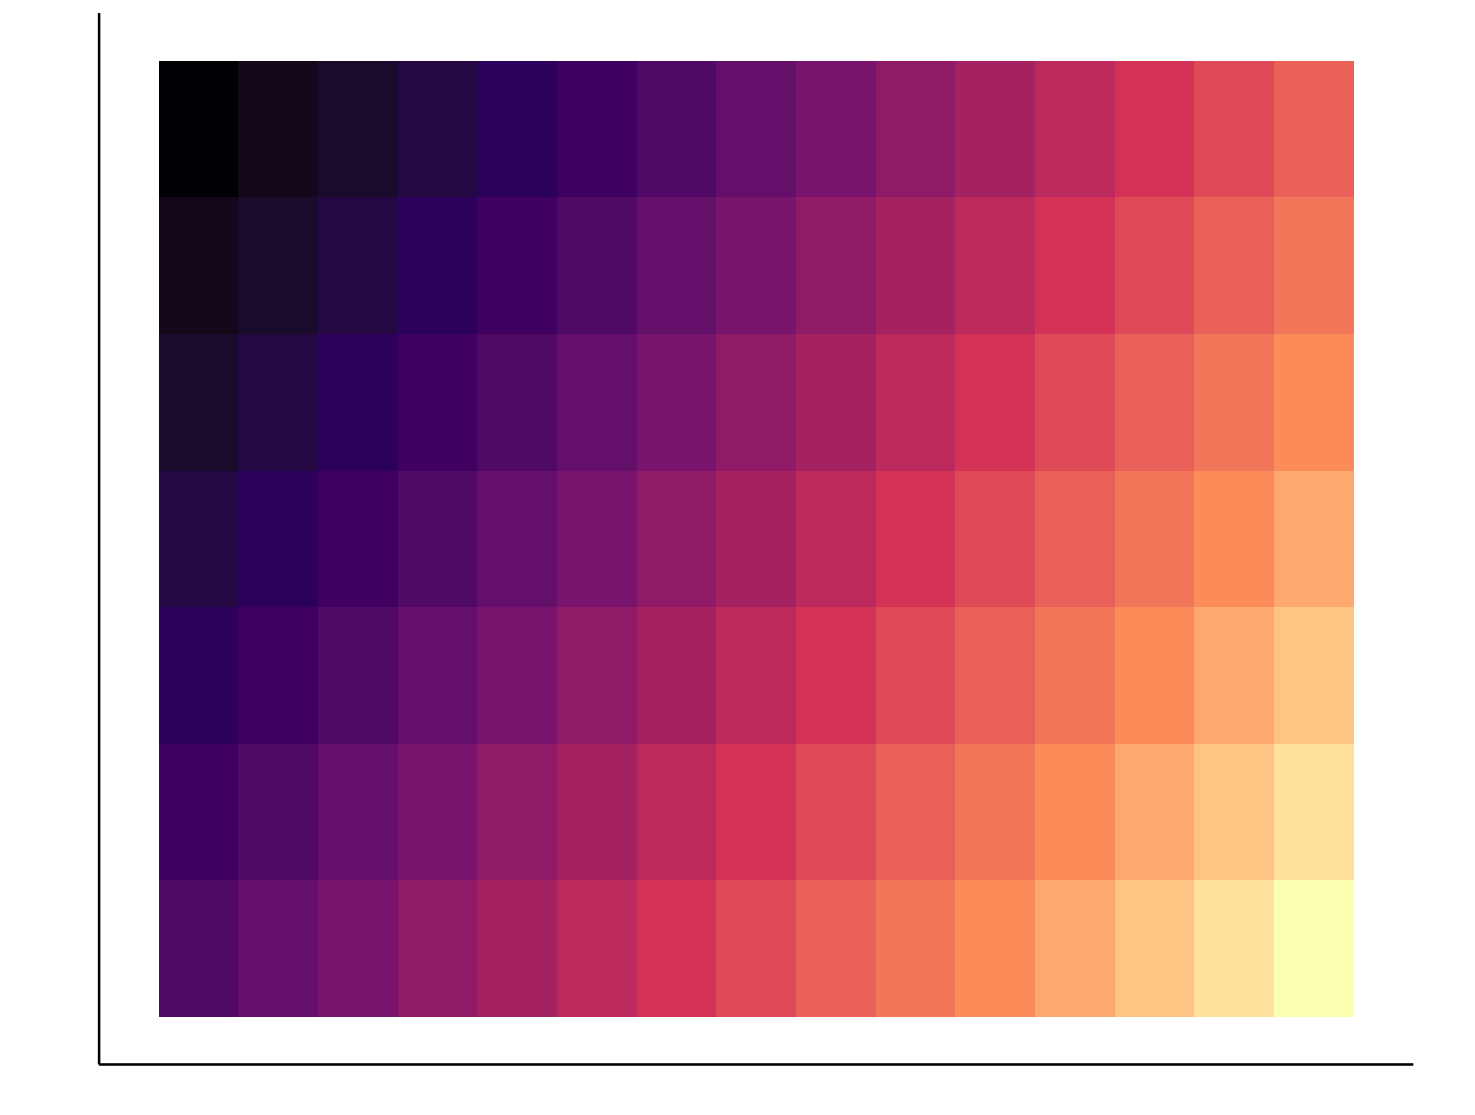
Heatmap Visualization
Correlation matrix with color gradients
Effortless Visualization
Vibeplot.ai simplifies the data visualization process, allowing you to focus on insights, not code.
Instant CSV Upload
Drag and drop your CSV file. We'll handle the rest, parsing your data in seconds.
AI-Powered Plotting
Describe the visualization you want. Our AI generates and renders your plot.
Agentic Error Correction
If the first attempt isn't perfect, our agentic system retries to fix any errors.
One Tool, Endless Applications
From journal figures to boardroom presentations, Vibeplot.ai adapts to whatever you're working on.
Researchers & Academics
Create publication-ready figures for journals, papers, and conference presentations. Meet exact formatting standards with ease.
Business Professionals
Build polished charts for reports, dashboards, and stakeholder presentations. Communicate data-driven insights clearly.
Students & Educators
Learn data visualization without the coding barrier. Perfect for coursework, teaching materials, and classroom demonstrations.
Data Enthusiasts
Whether you're exploring a personal dataset or working on a side project, get professional-quality plots without the learning curve.
Your Data Security is Our Priority
We've built Vibeplot.ai with privacy and security at its core. Your data never leaves your control.
Data Never Stored
Your data is processed in real-time and immediately discarded. We never retain your CSV files or generated outputs on our servers.
Data Provenance
Maintain complete control and traceability of your data. Know exactly where your data comes from and how it's used.
End-to-End Encryption
All data transfers are secured with industry-standard TLS encryption. Your information is protected at every step.
Audit Your Data Access
Full transparency with detailed access logs. Review exactly when and how your data was accessed.
Simple, Transparent Pricing
Choose the plan that fits your needs. Start free and scale as you grow.
- 3 plots per day
- 1 modification per plot
- Watermarked outputs
- 24 hours of full access
- Unlimited plots & modifications
- No watermarks
- No auto-renewal
- 1 user license
- Unlimited plots
- Unlimited modifications
- No watermarks
- Export in multiple formats
- 2+ user licenses
- Everything in Individual
- Team admin panel
- Central billing
- User management
- Usage analytics
*Multi-User plan requires minimum 2 users. Contact sales for volume discounts.